


My work often throws up surprisingly beautiful and dramatic images, as I manipulate and display sets of data or mathematical structures. I thought I would share them here for your delectation. If you want to use one of these images, feel free, but I’d appreciate being informed, and (if appropriate) acknowledged.
With a few exceptions, the names given to each images are just whimsical; they don’t have anything to do with how the image was generated. Where I can remember, I’ve jotted down how the image was made.
You can click on each image to obtain a larger version and description.
-
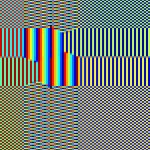
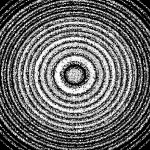
- Binary Random Dot Pattern
-
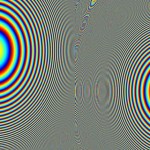
- Image generated from a Fourier analysis
-
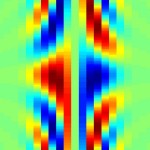
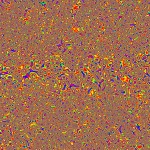
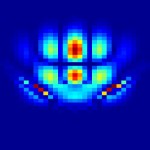
- Thrown up when I was examining Fourier phase for a 2D Gabor function.
-
- Thrown up when I was examining Fourier phase for a 2D Gabor function.
-
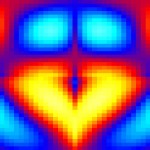
- Heart
-
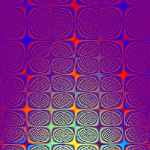
- Knot pattern
-
- Mandala
-
- Moire 6th July 2006 – This is an image I threw up when trying to correct the brightness inhomogeneity on my projectors.
-
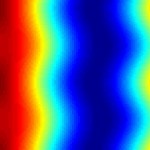
- Curtain Plot 1 – represent the population activity in energy-model neurons with both position- and phase-disparity
-
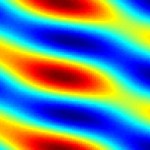
- Curtain Plot 2 – represents the population activity in energy-model neurons with both position- and phase-disparity. Position-disparity is along the horizontal axis and phase-disparity along the vertical.
-
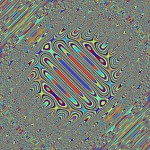
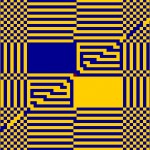
- Psychedelic – I made this image by generating a 16-bit image of a centre grating at 45 degrees surrounded by an annular grating at -45 degrees, and then pulling out the first 8 bits only. (There was a reason for this – I was trying to display a 16-bit image on my DATAPixx box.)
-
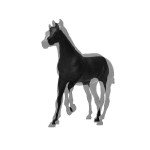
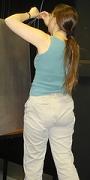
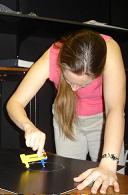
- Shadow Horse – I was trying to generate a stereo image of this model horse. This is the superposition of left and right images, something which is handy to look at to get an idea of the disparities in the image.
-
- Shadow Play
-
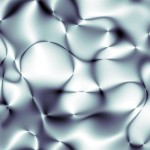
- Soap Bubble
-
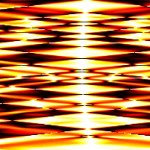
- Sunrise
-
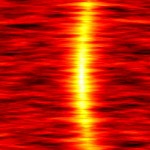
- Sunset
-
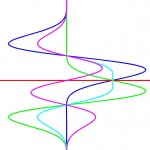
- Symmetry Phase – This represents a Gabor function and its odd and even components;
-
- Tree Frog
-
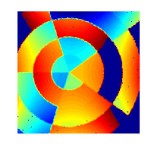
- Wheel