Click here for some background on gamma correction.
Graeme Phillipson, 8th May 2008
We began by obtaining separate gamma tables for each projector. The plots below show the linearisation obtained as a result. This graph shows the relationship between luminance and pixel value after correction for the top projector (250208_Top_New) .
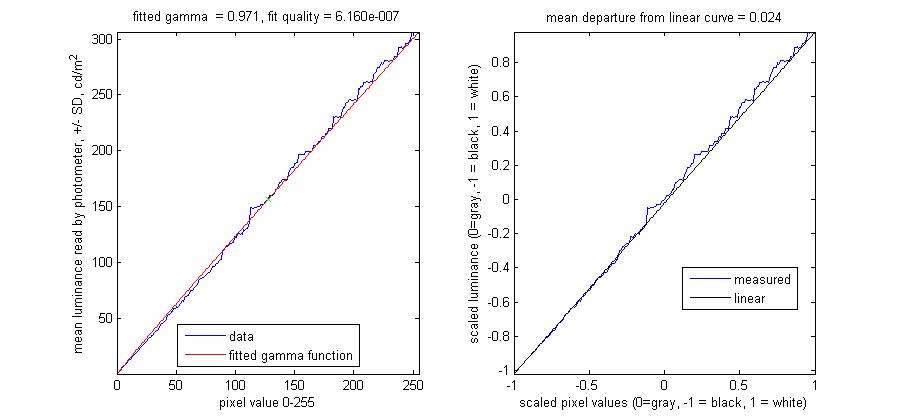
This graph shows the relationship between luminance and pixel value after correction for the bottom projector (250208_Bottom_New).
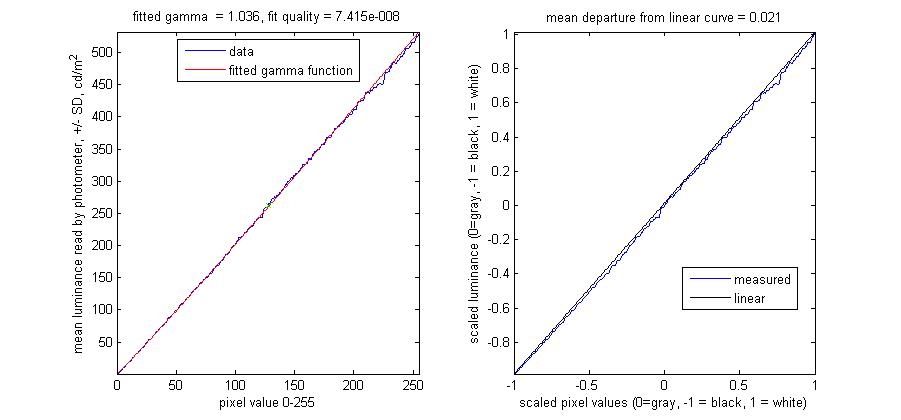
This graph shows the relationship between luminance produced by the top projector and pixel value when using a look-up table which is the average of the top and bottom projector look-up tables (230408_Average_NewLab.mat).
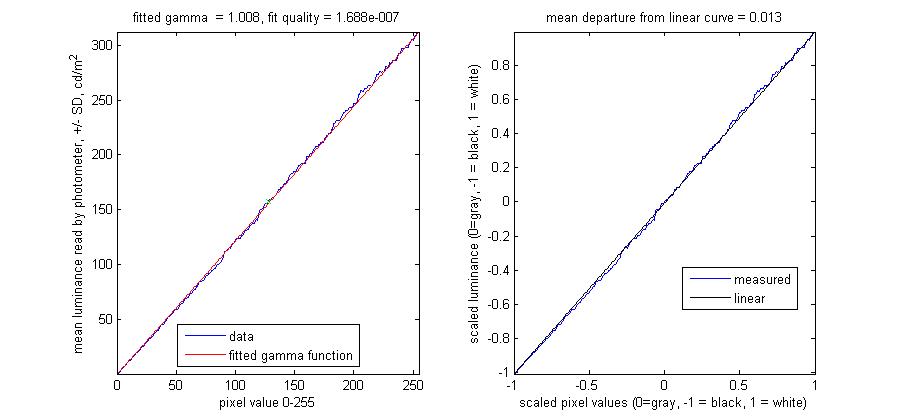
This graph shows the relationship between luminance produced by the bottom projector and pixel value when using a look-up table which is the average of the top and bottom projector look-up tables (230408_Average_NewLab.mat)).
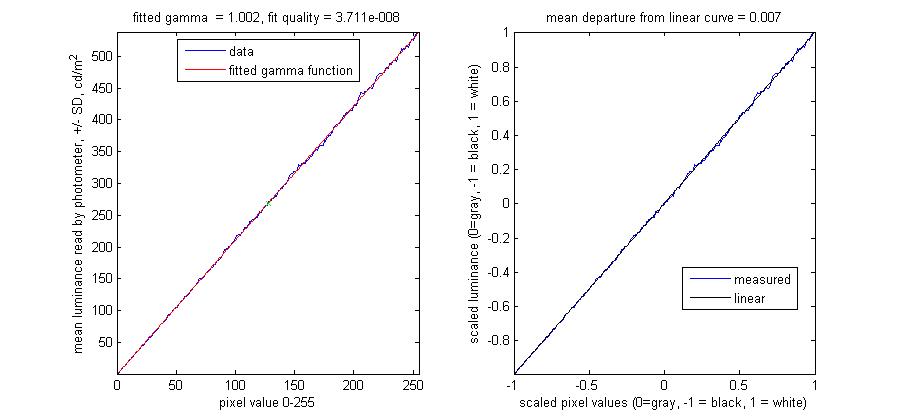
We felt that the average gamma table gave excellent linearisation for both projectors, and therefore did not need to set separate gamma tables for the two projectors. See herefor more on how to achieve this if necessary.
For all the above, the settings used for the projectors were:-
| Setting | Top Projector | Bottom Projector |
|---|---|---|
| Brightness | 50 | 50 or 30 for equal brightness |
| Contrast | 50 | 50 |
| Gamma | film1 | film1 |

